search
close
For example "Webinars"
close

See the next 2 Exhibitions and Conferences RigER team will exhibit at
Learn more

Why oilfield service companies should use business analytics

By Daria Maksymiak June 10, 2020
It’s undeniable that during past few years companies in all fields and industries are embracing the necessity for technology, data and business analytics.
To tell the truth, data was always to rule the world, it’s competition that changed. In today’s world the competition is much more global and severe than it was before. Now it is not enough just to have an interesting idea, good employees, and a strong sense of business. Today it is crucial to understand your company’s past performance and present inside/outside factors influencing the company, in order to prepare for the future.
Properly deployed analytics can give valuable insights for oilfield service companies that can help improve their operational efficiency. With business analytics they are able to determine which data is useful and how it can be used to solve problems and increase efficiency, productivity, and revenue. With all that data gathered and analyzed oilfield service companies can make decisions that are based on evidence rather than a guess. That’s called data driven decision making.
In this post we will explain what Business Analytics is, how it can be applied in oilfield services and give a few examples of the tools to use.
image

Industry 4.0 and Digital Oilfield Operations Software

Whether you like it or not, Industry 4.0 is here.
It is the part of the fourth industrial revolution that concerns industry. From the mechanization through water and steam power in the first revolution to the mass production using electricity in the second, the fourth industrial revolution enhances the adoption of computers and automations started with the third revolution with smart systems using big data and machine learning.
For oilfield companies that means moving their operations management from paper-based transactions via cloud and mobile solutions and business analytics to Oilfield 4.0.
A truly digital process helps accounting to bill accurately and faster and gives operations team real-time information on every piece of inventory, service, or rental fleet. It gives information weather the asset is sitting in the shop waiting to be sent to a client location, or if it is deployed, on a break, or needs to be inspected, repaired or when its next maintenance day due. Managers gain insights on operation results per each job, understand triggers, analyze profitability, define most profitable services and more.
In general, digital oilfield combines company’s management process with digital technologies to increase productivity, reduce costs and minimize the overall risks associated with oil and gas operations.
image

What is Business Analytics

Business analytics is the process of collecting, organizing, processing and studying data and what is most important – transforming data into useful business insights. In simple terms business analytics makes sense out of gathered data, measuring business performance, and producing valuable conclusions that can help companies make data-driven decisions on the future of their business. It puts all business data in use and connects the technical side of the company with the managerial, decision-making side of it.

Business Analytics in Oilfield

The importance of business analytics for oilfield companies is self-evident. Service and rental companies use data to help them make the best possible decisions. It’s not enough just to have data though. Companies need to know what to do with it – how to analyze It and make valuable conclusions out of that analysis. Those conclusions allow then to understand environment they operate in and find out how they can be more competitive, streamline their decision making, and maximize revenues.
Many OFS and OFR companies have already embraced business intelligence and other advanced analytics tools in their back offices, mostly for financial management and resource planning with being significantly further behind in operations technology. Others are still struggling to deploy and integrate digital platforms and technologies.
Still there is a significant number of data-driven companies that treat their data as a company asset and actively look for ways to turn it into a competitive advantage and consider predictive and other analytics software a must-have technology.
image

How Business Analytics Help Oilfield Companies Improve, Grow, and Overcome Challenges

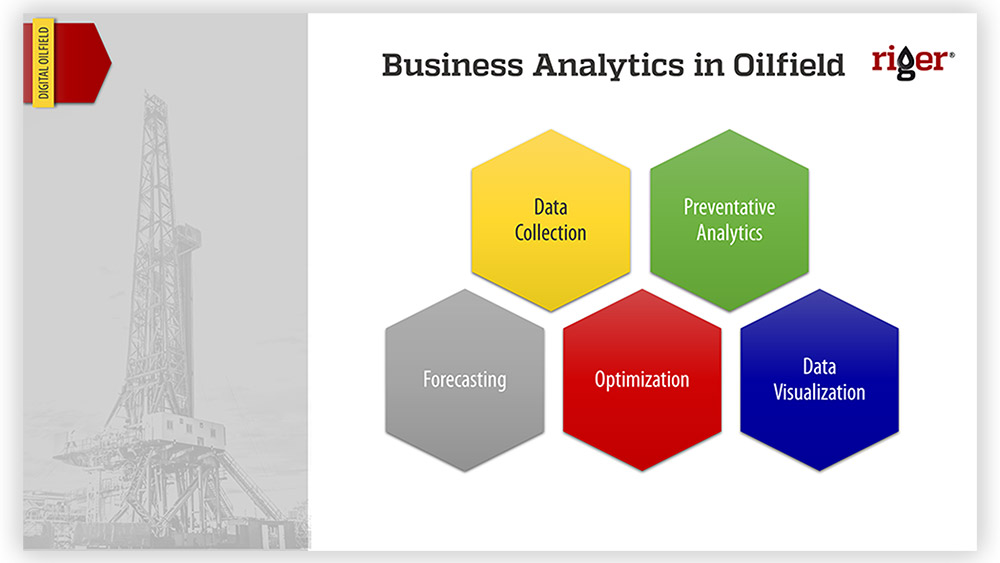
Let’s have a look into 5 ways that business analytics can assist OFS/OFR companies.
1. Data collection. It is the process of gathering data, organizing, and representing it in an understandable and structured format. This part is a foundation since all the conclusions and insights from data analysis depend on the accuracy and quality of data used. It is important to accurately record all the data from different resources and different people and organize it in one centralized system. For oilfield service and rentals companies that means keeping all information about their purchases, sales, inventory, field operations, equipment rentals, etc. up-to-date and in one easy to use system accessible from anywhere they operate.
2. Preventative analytics. The main concern here is to “stop before it happens”, whatever that is. As faulty or unreliable equipment is often a cause of work-related accidents or interrupted jobs in oilfield, having data on equipment condition before or during the job could improve safety and reduce risk of equipment failure.
3. Forecasting. With analytics oilfield businesses get a forecasting ability, which makes them more flexible and prepared for possible future risks. There could be lots of different types of forecasts for OFS companies. Like company revenue forecast, that includes short-term and long-term forecast based on different factors inside of the industry alongside with a number of more specific, non-industry-wide factors. Another thing is material, components, parts and units demand forecast. Tools used here can analyze all company activities in terms of customer demands and manage all company resources via data processing.
4. Optimization. Business analytics provides companies with insights into their operations, including data, processes, workflows and people, to help operations perform at maximum efficiency. It analyzes current state of business processes to get a baseline for process improvements and identify key problem areas to be addressed.
5. Data visualization. It is a representation of data using visual elements, such as charts, graphs, maps that helps understand trends and analyze massive amounts of information to make data-driven decisions. When it comes to data visualization in the oilfield, using that reduces the possibility of overlooked defects or mistakes that can be costly.

Tools for Business Analytics in Oilfield Operations

There is no one unique tool to be used for all parts, steps and types of business analytics. Depending on type of your company operations, your goals and level of processes digitalization you have or want to achieve you might want to choose one or even a couple of tools that will best cover your needs. Good thing that many of them can integrate with each other, which allows to avoid double data entry, human errors and saves time.
Here are just a few examples of tools that have business analytics functionality and can be used by companies in oilfield.
Power BI
Power BI is an interactive data visualization and analytics tool developed by Microsoft for business intelligence. It can pull data from a wide range of systems in the cloud or on premises and create dashboards to track figures that are most important for you. It allows to create rich reports or move dashboards and reports into reporting software you already use. Power BI has hundreds of content packs, templates and integrations for hundreds of data services, apps and services that include pre-set reports and visualizations.
riger®
The riger® solution is an operations management software designed specifically for oilfield service and rental companies. Amongst other it has a few modules that are used for analytics needs. First of all riger® gathers and stores all sorts of data on clients, employees, inventory, operations and any event or action happened to equipment. With Inspections and Maintenance modules it keeps track of equipment condition and notifies you of the date for next preventative maintenance. As a data visualization tool riger® has more than 110+ reports and a number of Dashboards to give real-time business insights: from assets availability and utilization to revenue and client analyses, and more.
SAS®
SAS® offers a few products for oilfield in terms of business analytics. That include Data management Software for gathering, organizing and storing data; Asset Performance Analytics with data visualization and predictive modeling; Visual Analytics offering dashboards, reports, BI and analytics, and others.

Learn more about Business Analytics features in riger®

image

Recent posts

Show all

Subscribe to all future blog posts

close
Subscribe to blog