search
close
For example "Webinars"
close

See the next 2 Exhibitions and Conferences RigER team will exhibit at
Learn more

Key Operational Reports For Oilfield

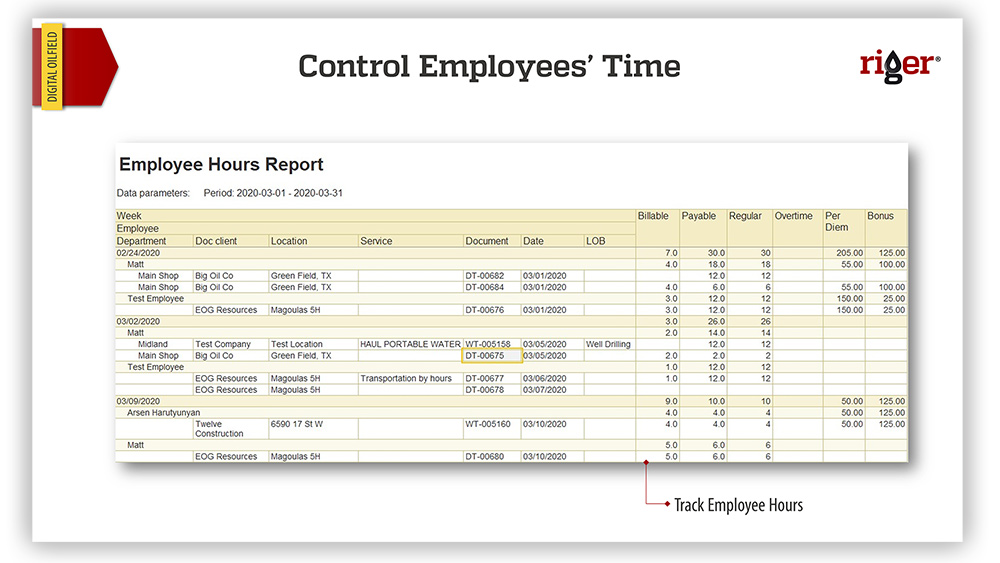
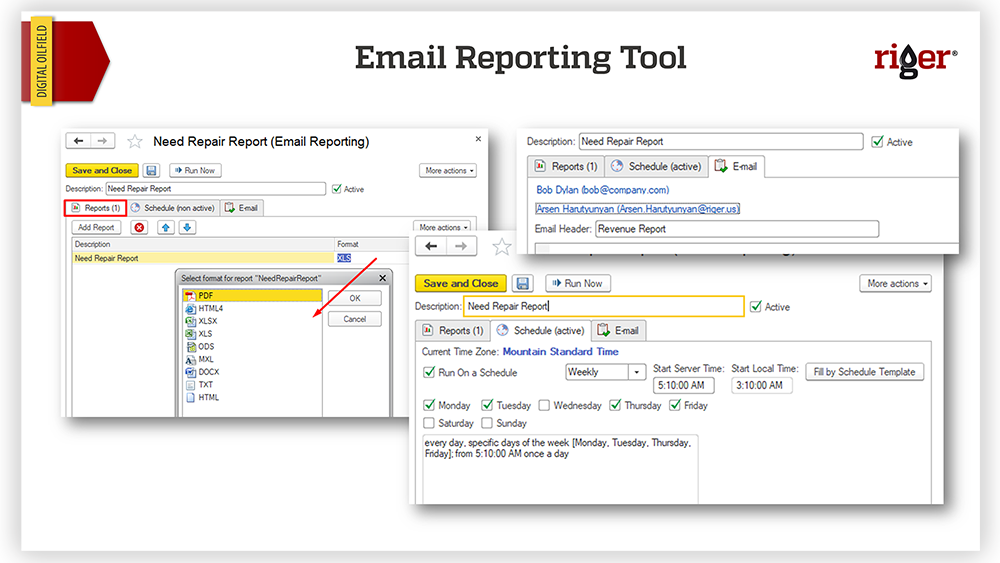
No good business decision can be made without reporting and analytics. Business reports provide useful insights for management such as information on spending, profits, and growth. But how long does it take you to create a report? Is the data it includes accurate?

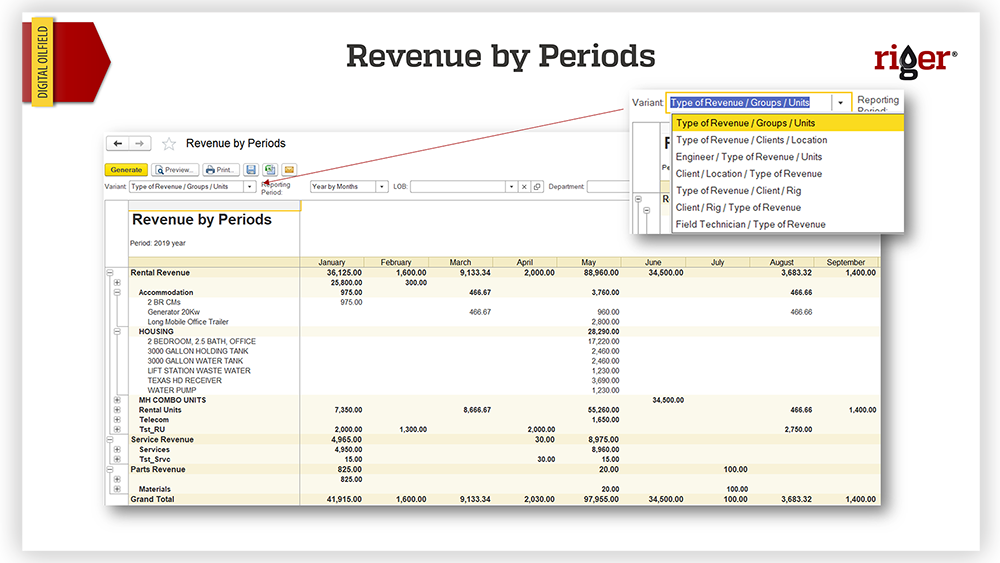
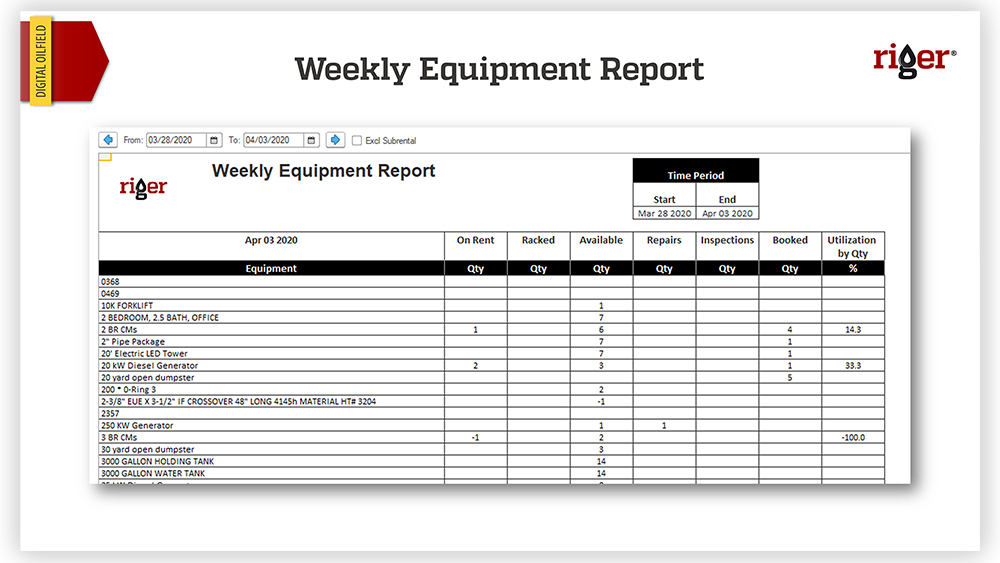
With RigER you can get a report showing the availability and location of every piece of equipment by 7 am every morning right into your inbox. Or you can see your revenue with a breakdown by customer, period, or a particular piece of equipment and its utilization rate by the end of every working day.

Get Use Of More Than 100 Reports

There are over 100 reports in RigER most of which are available in the default configuration. These reports are categorized and presented to the user in different sections, such as reports for “Rental Units”, “Inventory”, “Revenue”, “Tech Skills and Qualifications”, “List of Documents”, etc.
The ability to generate reports in RigER is based on a simple “three-step” process:
  • Recording every single action in the system
  • Store those recordings in corresponding information registers
  • Provide the report generation mechanism access to those information registers.
All the reports share a set of “common features” that allow to manipulate the report generation mechanism and manage the generated reports. This set includes:
Here are just a few examples:
  • Filters – that will allow to generate the report for only the values indicated in them
  • Radio buttons and checkboxes – that will change the sub-type of the report to be generated, or add/remove some information
  • Exporting – mechanism that allows to export the generated reports to other formats, such as for MS Excel
  • Printing – that makes it possible to print to paper or to a virtual printer (creating a pdf or .xps files)
  • Send by Email – grants the ability to manually send the generated report via email
  • Flat or Grouped reports – Generate Flat reports to be easily exported to and manipulated in MS Excel (or another spreadsheet application) OR Grouped – to have it grouped by certain hierarchy elements applicable to the current reports. (Groups can be expanded/collapsed)

Revenue Reports

There are around 20 different reports that focus on the revenue side of the information. Here are a few of them:
  • Accrues Revenue Report – Shows the accumulated revenue for the specific time (period can be set by user) for both rentals and services types of operations.
  • Gaps Days by Period – This report is most useful for the companies that work with other companies performing drilling operations and require different types/periods of invoicing for specific wells/pads. This report will allow to find those gaps between time periods that have not been invoiced for a specific customer or even a Rental Unit
  • Pre-Invoice Report – This report allows to see the numbers that will show up on the invoice for a specific date
  • Revenue ABC Analysis – Report provides a “A, B and C” groups breakdown of revenue generation by customers, revenue items or internal operations (such as sales). Useful for analytics to gain an idea which customers/items/etc. perform better than others and what exactly needs more focus
  • Revenue by Customers – breakdown of the revenue by customers
  • Revenue by Periods – breakdown of generated revenue by different criteria
  • Revenue Itemized Report – This report will show the breakdown of the revenue by all the invoices generated for a selected period of time
  • Unbilled Revenue Report – A report to see unbilled/missed revenue
  • Utilization Report – This report applies not only to the revenue but also to the operational side of the business and shows the utilization of particular piece of equipment and revenue generated by it.
image

Operation and Utilization Reports

At least half of all reports in RigER touch upon the Operations side of the business. There are reports that have a very specific focus, and there are others that cover all the operational processes. The following list shows just a few of those reports:
  • RU Deployment Report – shows information about deployment of particular pieces of equipment based on time period with the documents that have been involved in the process and recorded the movements
  • Location Report – most useful for dispatchers. Shows the Rental Units and Unit Numbers that have been deployed to a specific job location at a certain period of time
  • Rental Units Statuses and Locations – shows Rental Units and Unit Numbers with their corresponding statuses and Locations for the selected time period
  • RU History – Displays the history of the movement (and the according status changes) of a particular item in the system
  • Inventory On Hand – shows the quantities of Inventory (consumables – materials/parts/etc.) available in the shops at a certain point in time
  • Inventory Turnover Report – shows the opening and closing balances and the movement of the inventory for a selected period of time
  • RU Technical Report – will show the technical history of a particular item (inspections, repairs, etc.)
  • Need Repair Report – shows the list of items that need repair (defined by the “Need Repair” condition of the item
  • Rental Units Utilization – shows the utilization percentage of Rental Units for a selected time period
  • Morning Equipment Report – shows more detailed utilization information broken down by shops and types of operations
  • Field Tech Status History – shows the workforce utilization for a specific time period
image

HR and Safety Report

There are quite a few Safety and HR oriented reports in RigER. Safety reports are very specific and highly dependent on the client side of operations thus the look/feel and different aspects of all those reports shall be defined separately for each client. Here are a few of them:
  • Check List Report – report that will show information about different safety checklists set different items
  • Inspection Report FT – shows information about inspections performed by Field technicians based on an inspection checklist of a vehicle
  • Inspection Report FT – same as the previous report with more detailed focus
  • Truck Inspection Report – shows inspection history of a particular truck for a selected time period
image
The HR reports are, like most other reports that are available in RigER, more generic and can apply to any time of HR process. Below you can see a few of those reports:
  • Employee Hours Report – a report that shows information about each employee regarding the jobs s/he was working on, hours spent on the job (billable/payable/overtime/etc.). It can also calculate and present payroll information for each employee based on HR module settings already in place.
  • Labor Cost Analysis Report – displays information about how much is spent on labor with a breakdown by Line Of Business/Department for each employee/job, locations of the jobs, hours spent on it, etc.
  • Sales Commission Report – this report takes information from invoices generated in the system for a particular period of time and (based on Sales and HR module configuration settings) can calculate/show sales commissions information
Email Reporting Tool
This is a powerful automation tool incorporated in RigER that allows to generate reports based on a preconfigured set of rules and send them to pre-configured list of recipients at a certain day/time or using a predefined schedule (daily/weekly/specific days etc.). This is very useful for management to have the most current information in the form of different reports automatically sent to their email.
image

Dashboards

Dashboards in RigER act as dynamic reporting/analytical tools which also allow direct data access and manipulation depending on pre-configured settings of the system. There are several dashboards that are already available. Here are just a few to mention:
  • Availability Dashboard – most common dashboard as of today, which by default configuration acts as a home screen in RigER®. This dashboard shows general information about the availability of each Rental Unit that exists in the system and allow have more detailed and in-depth information to be seen when you select a particular item
  • Activity Log Dashboard – represents information about individual assets with different statuses in different locations at a certain period in time, broken down and sortable by department/service managers/statuses etc.
  • Service Call Dashboard – this dashboard allows to capture and record all the service calls coming in from customers. Each service call can be categorized, prioritized and forwarded to next responsible who will need to act on it. All the service calls are represented in this dashboard according to their statuses, categories, priorities etc. and can be directly manipulated from within the dashboard.
  • Repair Dashboard – displays information about all the items that are pending repair, and allows to perform repair operations directly from within (e.g. set priority for repairs, set it as billable, check if the repair has already been performed, check if repair is a rework, etc.)
  • Rework Dashboard – this dashboard allows to manage all the rework operations. Rework is the process utilized by some companies that allows third parties to perform repair operations on particular items. Generation of Rework POs and Rework Bills of Lading (types out and in) can all be done directly through this dashboard by just selecting the corresponding item.
image

What is My Daily Revenue?

Contact us, schedule a demo, and let us show you how you can know what is your daily P&L

Features To Explore

image
Track purchases of rental units, consumables and services.
Learn more
image
Track costs and utilization rate of 3rd party rental units in one system.
Learn more
image
Manage organizational structure, pay rates, sales commissions and more.
Learn more