search
close
For example "Webinars"
close

See the next 2 Exhibitions and Conferences RigER team will exhibit at
Learn more

By Qanat Nemat October 7, 2020

Integration between riger® and Power BI

Business Intelligence is the analysis of Business Data. And when we talk about Data Analysis, we are talking about analyzing historical data that took place in the past and based on the past data forecasting data analysis into the future.
There are four types of analysis:
  • Descriptive
  • Diagnostic
  • Predictive
  • Prescriptive
Descriptive analysis – describes what happened in the historical data. Diagnostic – describes why certain things happened in the past. Predictive analysis – based on the past events, predict what will happen in the future. Prescriptive analysis – gives recommendations of what to do in case certain event will happen.
Today we will be talking about Descriptive and Diagnostic analysis using riger® and Power BI integration. However, it is also possible to run Predictive and Prescriptive analysis using such BI visualization tools as Power BI, but that mostly depends on the readiness of your company in terms of volumes of data produced on a daily basis, complexity of operations, process maturity level and other factors.

Business Intelligence Importance

With increasing volumes of operational data, our clients inquire about data analyzing and visualizing tools to help them manage their operations. Today we witness that different sources of data, such as Marketing, Sales, Technical, Operational, and Financial, is available for the companies to analyze together. So, it is time to have an Advanced Business Analysis, and that is why we decided to connect riger® with Power BI to analyze oilfield data.
image
As part of Oilfield Dashboards development, having KPI measurements is important. Below is the list of our suggestions for the Oilfield KPI’s:
Marketing and Sales:
  • Marketing Activity
  • Sales Activity
  • Opportunities (Leads)
Human Resources:
  • Field Technician Qualifications
  • Safety Indicators
  • Footprint Indicators
Services:
  • Field Technician Utilization
  • Service Revenue
  • Service Cost
Rental Fleet:
  • Rental Unit Utilization
  • Rental Unit Availability
  • Equipment TCO, Age
Quality:
  • Service Calls
  • Equipment Repairs
  • Client Feedback
Financial:
  • Revenue
  • Job Profitability
  • Job Costing

Power BI Integration

image
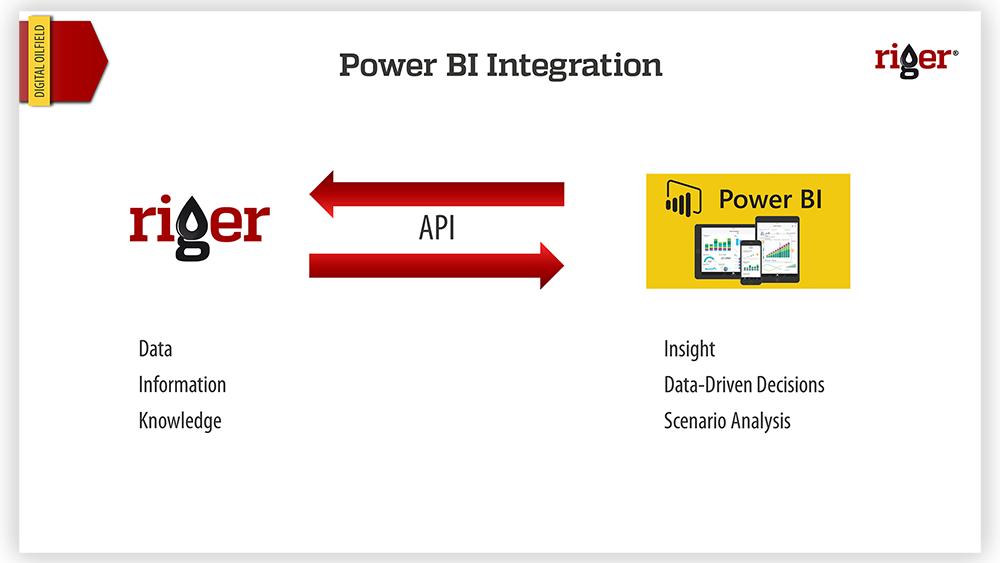
Let us talk about Power BI integration. Put in short, we connect riger® and Power BI through an API, an application programming interface which enables the connection between different software solutions.
In case you are running multiple applications and you have a need to integrate them, as the first step look for the API connectors. Another thing to keep in mind is that API is not the key to all doors, as not all applications have these connectors enabled. However, in case of riger® and Power BI, both apps use an API to get connected.
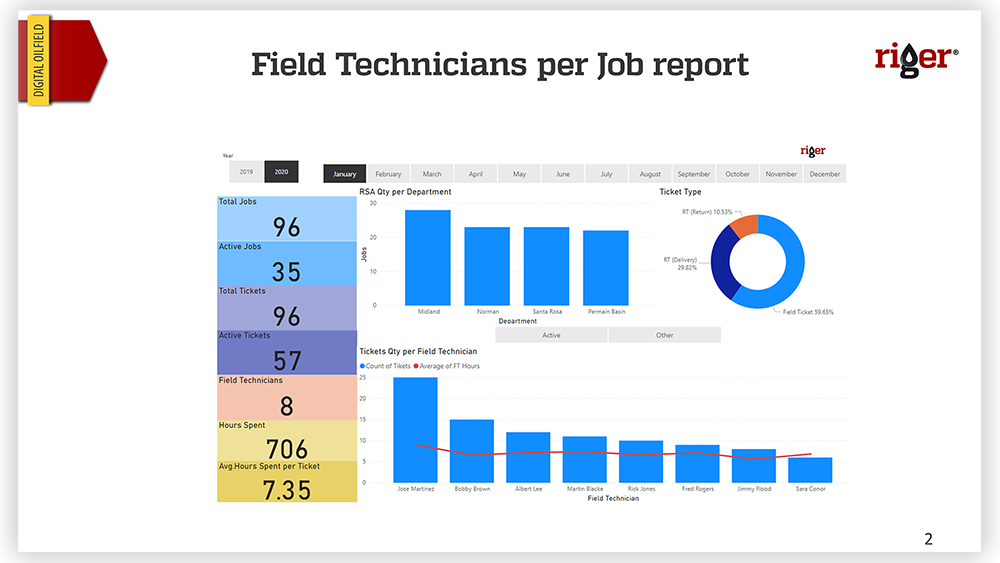
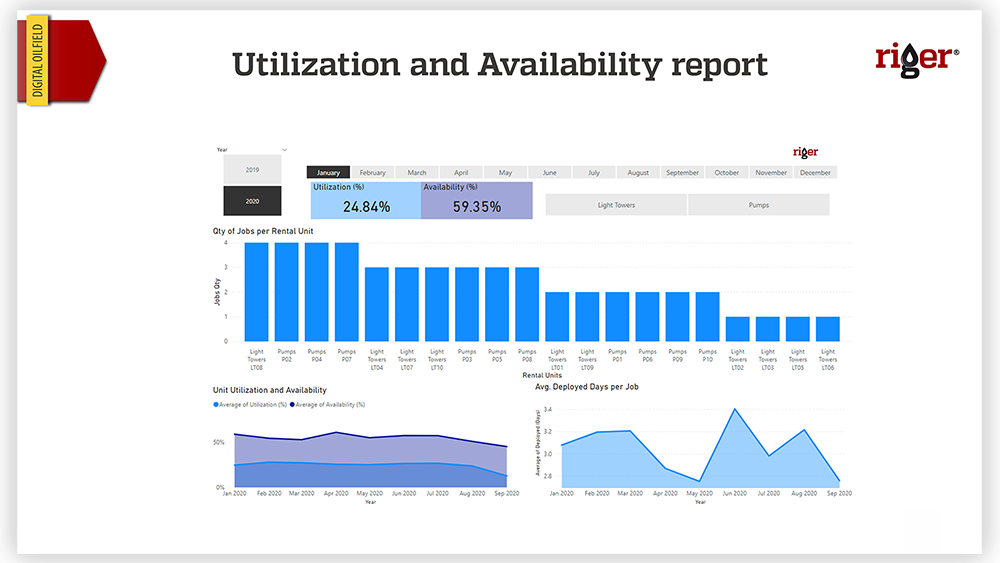
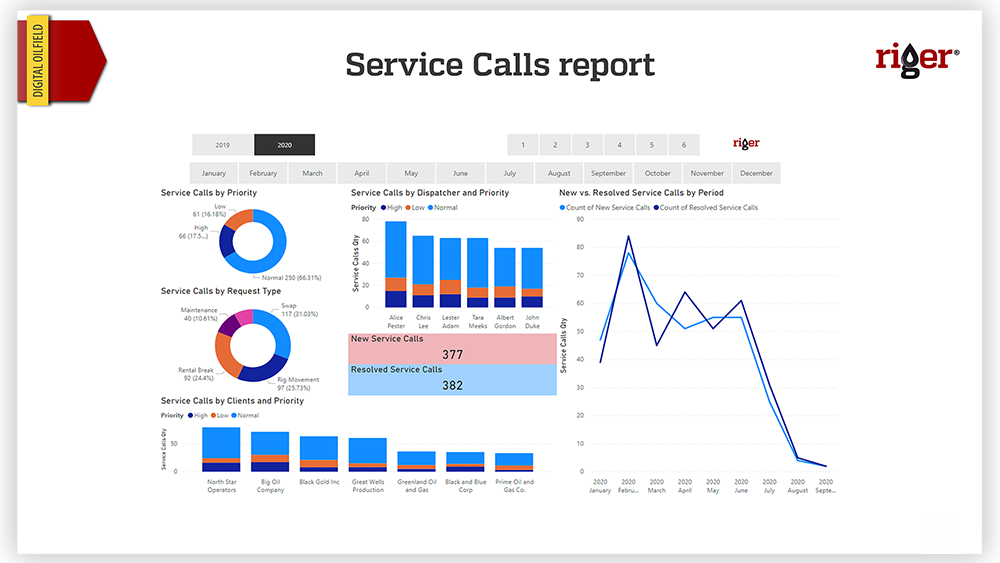
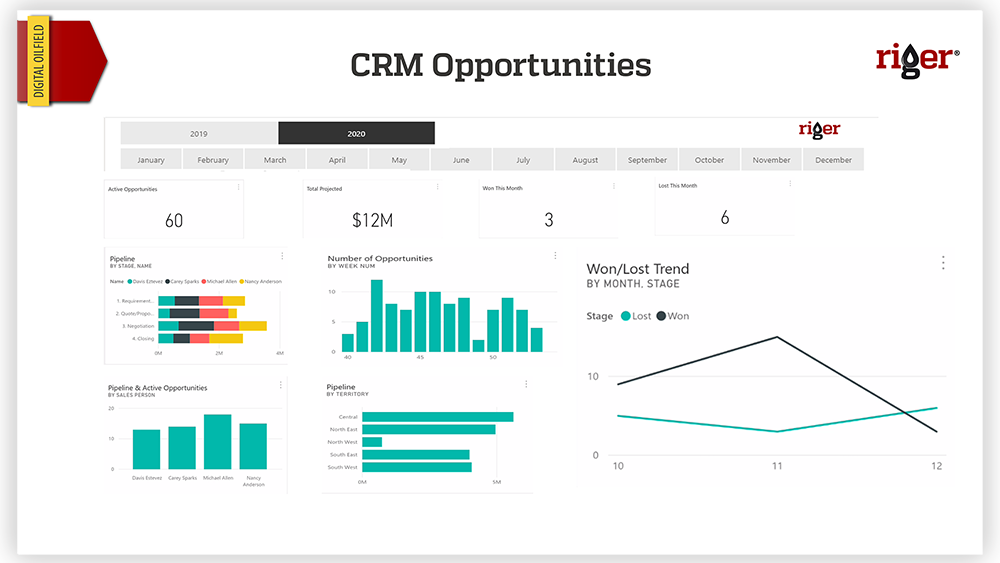
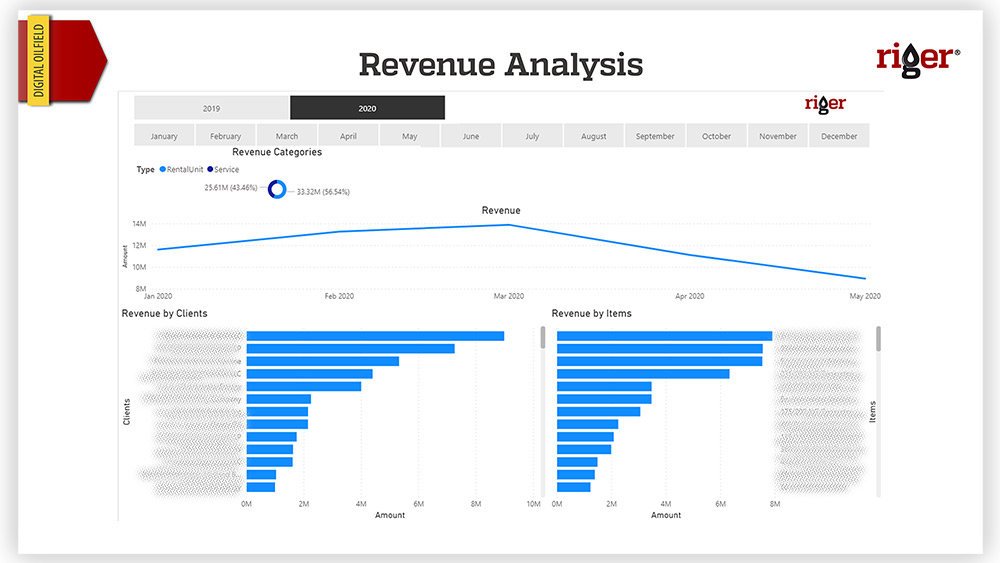
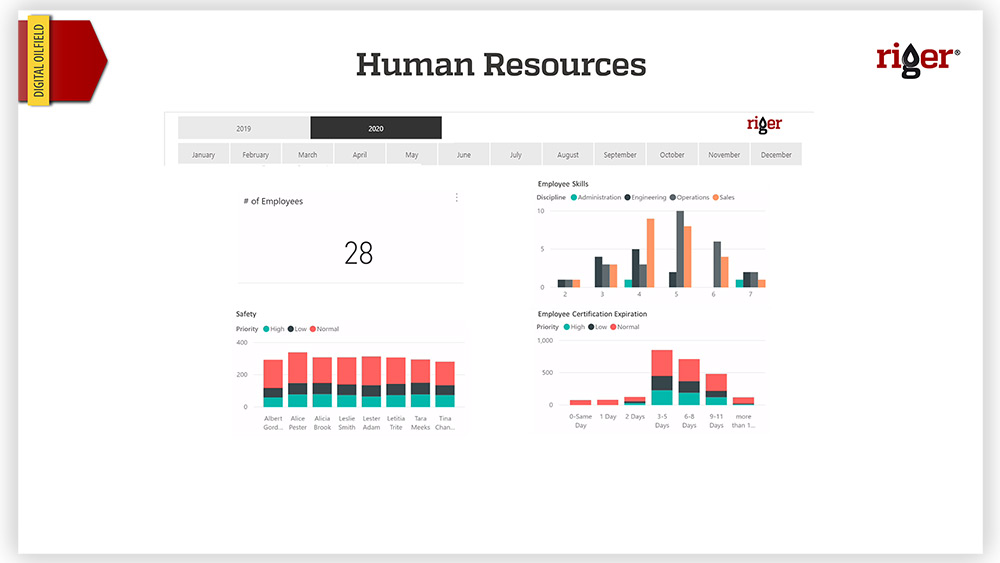
So, riger® is the storage of Data, Information, and Knowledge, and getting those into the Power BI engine, we can produce powerful Insights that will boost the quality of data-driven decisions and scenario analysis in your company.
The process of connecting riger® and Power BI is as follows:
  • Enable the connector in riger® Database and issue the URL-address.
  • In Power BI, connect to that URL-address.
  • Authenticate the user with the same credentials as in riger®.
  • The connection is established.

Integration Process

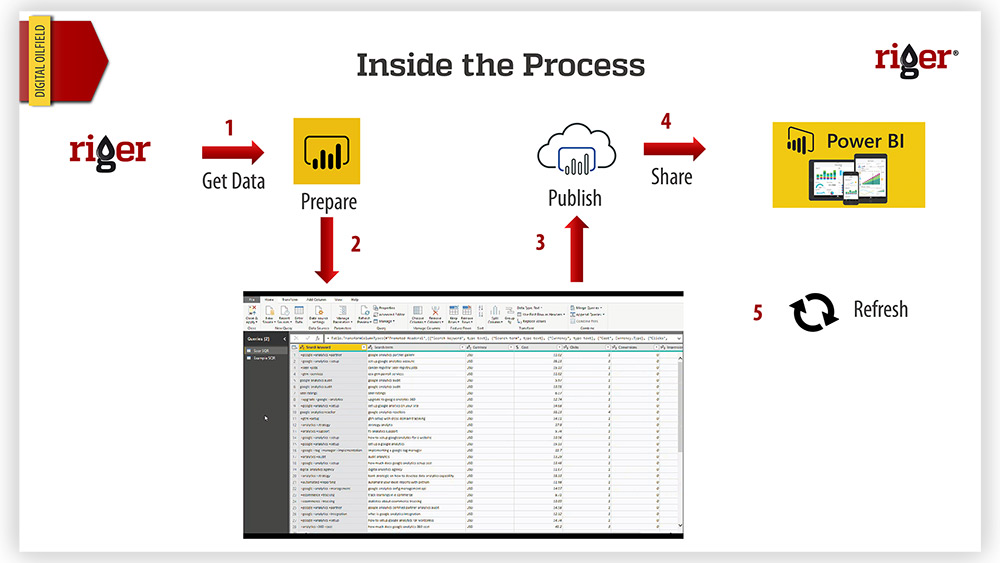
Let us zoom into the process of getting data from riger® and then showing insights in Power BI. As I mentioned above, we do connect riger® and Power BI through the API. After the connection is established, in Power BI, we ‘Get data’ from riger®, and, once we get it, we start preparing data. We slice it, we dice it. This is a time consuming and detail-oriented work process that usually takes about 80% of time to deliver powerful visuals and reports to the end users. You can have a quick look into the kitchen of Power BI, this is how data transformation process looks like.
Once preparation of data is done, all reports are published to the Power BI Web Service, from where we can start sharing these reports with others. And Power BI has flexible options for sharing reports and dashboards as well as refreshing them at a daily, weekly and on demand basis.
However, as in any development, there are few requirements. So, let us go over those requirements.
image

BI Requirements

Business Intelligence is a separate module in riger®, and thus it comes with its own requirements. Given the nature of our client implementations, all clients have different riger® configurations and different modules enabled. Hence, Power BI dashboards must be configured accordingly, depending on what data in the riger® configuration we could use.
As for the analysis part of the requirements, we assume that every client will have their own preferences as to:
  • which kind of reports they would like to have;
  • what they would like to see in their reports specifically;
  • who must have it when they must have it, and how they must access it, whether it would be via web browser on the desktop, on a tablet, or through the mobile application.
Also, one of the pre-requisites is to make sure that your riger® database have enough data, which is minimum of 6-12 month of historical data. Of course, this requirement depends on the nature of your analysis, may be to build certain reports having 2-3 months of data is enough. Overall, my message is that the richer data you have, the better insights we can get out of it.
And another thing that I must mention, is that our Clients should have their own Power BI Pro licenses to be able to use riger® dashboards in Power BI. And if you are in SharePoint and Microsoft environment, then it should not be hard to add additional Power BI licenses.

Reports vs BI

Comparing built-in reporting in riger® and Power BI reporting, we see pros and cons of using each method. First, riger® has a transactional database. Power BI dashboards, build upon data cubes, are based on relational database. Second, this difference in database structures, when working with huge volumes of data allows Power BI to load reports fast, while riger® speed of response can be slower. Talking about the visualization tools, riger® has basic visualization options in comparison to more advanced features of Power BI. Regarding the delivery options, riger® reports are included with the configuration, while Power BI requires some integration. Hence, cost of delivery of riger® reports are included in riger® licensing, Power BI requires additional licensing and integration expenses. Finally, riger® reports use only data generated in the riger® configuration, while Power BI can aggregate different data sources including riger® oilfield data.
image
Next, I would like to go over reports that I developed and provide case examples of what could be done using riger® data.

Power BI dashboards

Field Technicians per Job report
image
To build the report we used data from RSAs, tickets, and crew tab within those tickets. Such analysis can help Office Managers answer following questions:
  • For example, what were the Average hours per Field Technician in March 2020 and compare it with April 2020
  • and compare different Departments performance
Utilization and Availability report
image
To build this report we retrieved data from RSAs and Rental Unit Statuses generated in riger®. This report is mainly aimed to help Managers to:
  • analyze and compare Performance of different rental units
  • and better allocate units with lower Utilization rates
Service Calls report
image
We used data from service call logs in riger® to build this dashboard. The main purpose of this report is to help managers:
  • spot most troubled clients
  • identify most requested services
  • and compare dispatchers’ performance on client support
CRM report
This is the CRM opportunities analysis. To build this report we used data from the CRM module in riger®
image
Revenue Analysis report
Next is the Revenue Analysis. We used Clients, Rental units and Services, and Job Invoices to build this report.
image
Human Resource report
Finally, this is HR analysis. We used data from the HR module in riger® to build this report.
image
As you see, Power BI dashboards give us an opportunity to build responsive and visual reports that can dramatically help C-level managers achieve and/or stay on track of their business goals. Below is the table showing how we could build dashboards based on the roles of managers.
image
Today, we could use these dashboards on a daily/weekly basis to show operational KPIs and reports, however, the next level where we think we need to move is to start analyzing different operational scenarios and what-if analysis.
Key takeaways:
  • riger® and Power BI can be integrated.
  • Power BI reports are powerful tool for C-level management to use for monitoring overall company performance metrics.
  • Oilfield data could be meshed up with other data sources to get more informative insights.
  • Using riger® and Power BI can increase the quality of data-driven decisions.
  • With rich volumes of Oilfield data from riger®, it is possible to develop Predictive and Prescriptive analytics using BI tools.
Book your demo today to see integration® in action!
image

Recent posts

Show all

close
Subscribe to blog