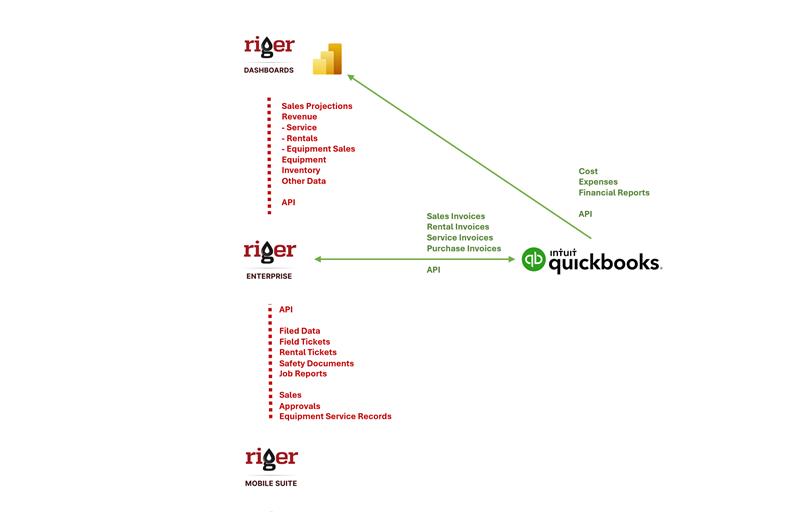
What the RigER + QuickBooks Executive Dashboard Unlocks
🔗 Real-Time Financial Visibility Tied to Operations
Revenue, cost, and margin are connected to specific jobs and crews – not just general ledger lines. Leadership sees financial performance in context, not in isolation.
📊 Unified Operations and Finance Reporting
One dashboard for the executive team. No more toggling between dispatch and accounting trying to reconcile what actually happened on a job.
⚡ Faster, Cleaner Month-End Close
Field tickets flow through approvals and billing directly into QuickBooks – automated, consistent, and fully auditable. Close faster with fewer errors and no end-of-month reconciliation surprises.
📍 True Job Costing
Know exactly which customers, service lines, and crews are profitable. Identify pricing leakage, unbilled items, and scope drift before they become P&L problems.
📈 Daily Rental Revenue Tracking
Visibility every morning, not at month-end. Faster detection of missing pickup tickets, idle billing days, and revenue gaps before they compound.
🛠 Equipment Utilization Analysis with Financial Impact
Identify idle assets draining margin before they appear on your P&L. Tie utilization rates, downtime events, and maintenance costs back to real revenue and cost outcomes.
Why This Matters in 2026
The best-run oilfield service companies are not just operationally efficient. They have financial intelligence built into how they operate every single day.
QuickBooks raised the floor on profitability analytics.
RigER brings those analytics into the field and anchors them to the realities of crews, tickets, rentals, and equipment – where the numbers are actually made.
That is the competitive advantage available right now: decisions made with clean, current data – not post-mortems built on stale reports. The operators who build financial intelligence into their daily operations in 2026 will not just outperform their competition. They will define what good looks like in oilfield services.